Bank Of India ELSS Tax Saver
-
Fund Type : An Open Ended Equity Linked Saving Scheme with a statutory lock in of 3 years and tax benefitEntry Load : NilDate of Allotment : February 25, 2009
-
Benchmark :BSE 500 Total Return Index (TRI)Exit Load :
- Nil
Investment Objective
The Scheme seeks to generate long-term capital growth from a diversified portfolio of predominantly equity and equity-related securities across all market capitalizations. The Scheme is in the nature of diversified multi-cap fund. The Scheme is not providing any assured or guaranteed returns. There can be no assurance that the investment objectives of the Scheme will be realized.
Fund Manager
-
ALOK SINGH
CFA and PGDBA from ICFAI Business School.
 See detail
Fund Highlights
Riskometer
Scheme Riskometer:
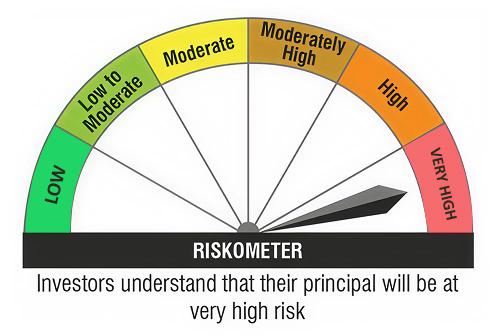
The above Riskometer is based on the portfolio as on 30th June, 2026.
This product is suitable for investors who are seeking*:
- Long-term capital growth.
- Investment in equity and equity related securities of companies across market capitalisations.
Benchmark Riskometer : BSE 500 TRI:

*Investor should consult their financial advisor if in doubt about whether the product is suitable for them
The above Benchmark Riskometer is based on the portfolio as on 30th June, 2026.
Top 10 Portfolio Holdings
Sector Allocation
- Portfolio weight (%)
- Benchmark weight (%)
Performance for Regular-Growth Plan
| Current Value of Standard Investment of Rs 10000 in the | |||||||
|---|---|---|---|---|---|---|---|
| Date | NAV Per Unit(Rs.) | Scheme Returns(%)^ | Benchmark Returns #(%) | Additional Benchmark Returns # #(%) | Scheme (Rs) | Benchmark #(Rs) | Additional Benchmark # # (Rs) |
| 1 yrs | 159.0800 | 1.04 % | -0.07 % | -3.84 % | 10104 | 9993 | 9616 |
| 3 yrs | 104.6100 | 15.41 % | 13.48 % | 9.54 % | 15365 | 14608 | 13140 |
| 5 yrs | 85.6300 | 13.43 % | 12.30 % | 9.88 % | 18770 | 17854 | 16012 |
| 10 yrs | 36.6400 | 15.93 % | 14.03 % | 12.54 % | 43867 | 37177 | 32593 |
| Since inception | 10.0000 | 17.45 % | 16.37 % | 14.56 % | 160730 | 137122 | 104507 |
IDCW History(Regular Plan- Regular IDCW)
| Record Date | IDCW (`/Unit) |
|---|---|
| 30-June-2021 | 2.00 |
| 29-July-2021 | 0.90 |
| CLICK HERE TO VIEW THE IDCW HISTORY |