
Bank Of India Overnight Fund
-
Fund Type : An open ended debt scheme investing in overnight securities. A Relatively Low Interest Rate Risk and A Relatively Low Credit Risk.Entry Load : NADate of Allotment : January 28, 2020
-
Benchmark :Tier 1: CRISIL Liquid Overnight IndexExit Load :Nil
Investment Objective
The investment objective of the scheme is to generate income commensurate with low risk and high liquidity by investing in overnight securities having residual maturity of 1 business day. However, there can be no assurance that the investment objectives of the Scheme will be realized. The Scheme does not assure or guarantee any returns.
Fund Manager
Mr. Mithraem Bharucha
BMS and MBA
 See detail
Fund Highlights
Riskometer
Scheme Riskometer:
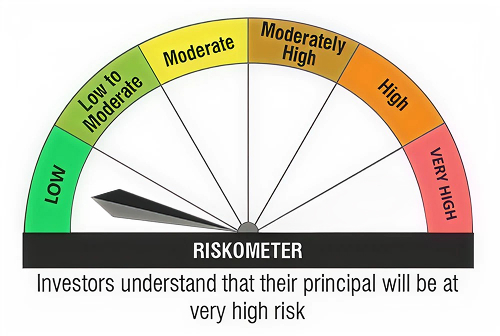
The above Riskometer is based on the portfolio as on 30th September 2026.
This product is suitable for investors who are seeking*:
- Income over short term with low risk and high liquidity
- Investments in overnight securities having residual maturity of 1 business day.
Benchmark Riskometer: Tier 1: CRISIL Liquid Overnight Index:
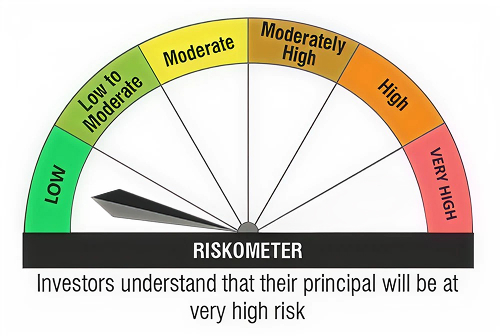
*Investor should consult their financial advisor if in doubt about whether the product is suitable for them
The above Benchmark Riskometer is based on the portfolio as on 30th September 2026.
| Potential Risk Class Matrix | |||||||||
|---|---|---|---|---|---|---|---|---|---|
| Credit Risk | Relatively Low (Class A) | Moderate (Class B) | Relatively High (Class C) | ||||||
| Interest rate Risk | |||||||||
| Relatively Low (Class I) | A-I | ||||||||
| Moderate (Class II) | |||||||||
| Relatively High (Class III) | |||||||||
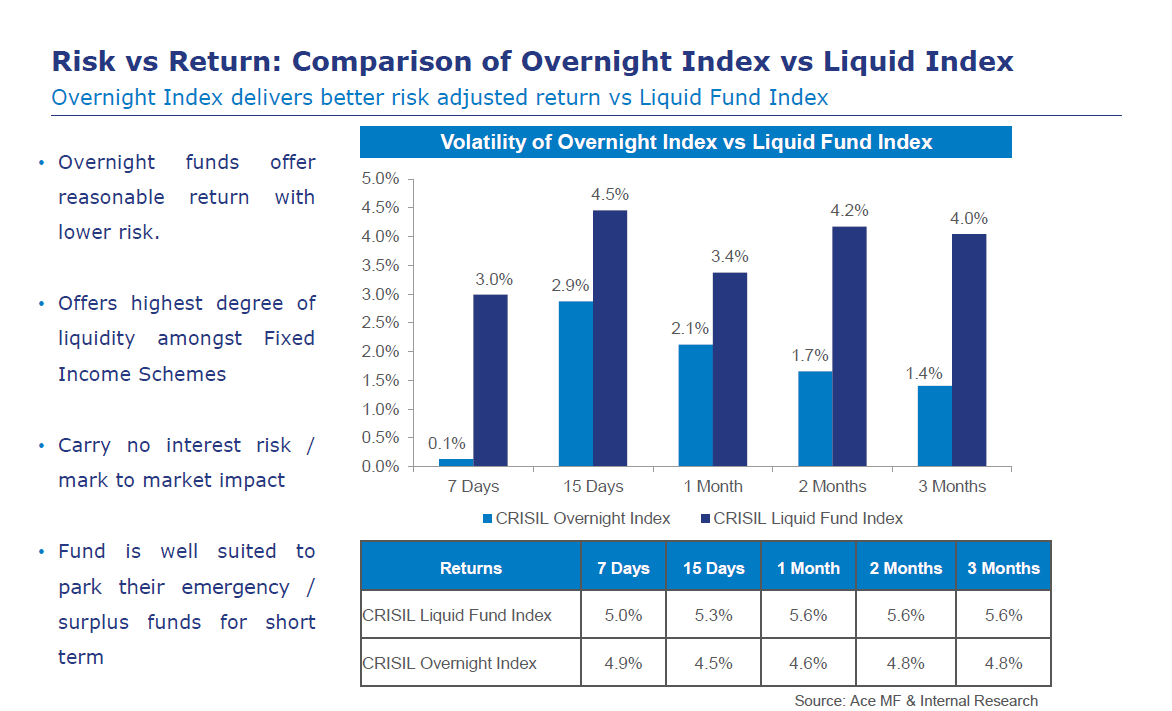
Note: Annualized data for returns and Standard deviation as of Jan 16, 2019
Fund Performance
- Scheme
- Benchmark
Performance for Regular-Growth Plan
| Current Value of Standard Investment of Rs 10000 in the | |||||||
|---|---|---|---|---|---|---|---|
| Date | NAV Per Unit(Rs.) | Scheme Returns(%)^ | Benchmark Returns #(%) | Additional Benchmark Returns # #(%) | Scheme (Rs) | Benchmark #(Rs) | Additional Benchmark # #(Rs) |
| 7 Days | 1399.9729 | 4.96 % | 5.09 % | 0.43 % | 10009 | 10010 | 10001 |
| 15 Days | 1398.4443 | 4.98 % | 5.07 % | -1.73 % | 10020 | 10020 | 9993 |
| 30 Days | 1395.5153 | 5.05 % | 4.83 % | 1.68 % | 10041 | 10039 | 10014 |
| 3 Months | 1383.4987 | 5.11 % | 5.04 % | 3.09 % | 10126 | 10125 | 10077 |
| 6 Months | 1363.8855 | 5.47 % | 5.12 % | 3.99 % | 10270 | 10259 | 10199 |
| 1 Year | 1328.6897 | 5.47 % | 5.24 % | 4.01 % | 10547 | 10524 | 10401 |
| 3 Years | 1170.9296 | 6.16 % | 6.06 % | 6.14 % | 11967 | 11931 | 11958 |
| 5 Years | 1056.0102 | 5.82 % | 5.76 % | 5.66 % | 13488 | 13232 | 13169 |
| Since inception | 1000.0000 | 5.18 % | 5.13 % | 5.47 % | 14013 | 13964 | 14274 |
IDCW History (Regular Plan - Annual Dividend)
| Record Date | IDCW (`/Unit) |
|---|---|
| 27-March-26 | 3.9749793 |
| 27-March-26 | 3.9749793 |
| 27-April-26 | 4.5530000 |
| 27-April-26 | 4.5530000 |
| CLICK HERE TO VIEW THE IDCW HISTORY |